Compare Strategies
| SHORT PUT BUTTERFLY | SHORT PUT LADDER | |
|---|---|---|
|
|
|
| About Strategy |
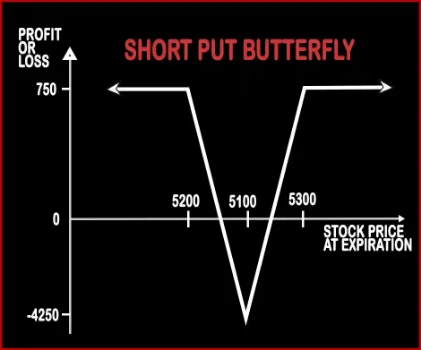
Short Put Butterfly Option StrategyIn Short Put Butterfly strategy, a trader is neutral in nature and expects the market to remain range bound in the near future. A trader will buy 2 ATM Put Options; sell 1 ITM & 1 OTM Put Options. Here risk and returns both are limited. Risk:< |
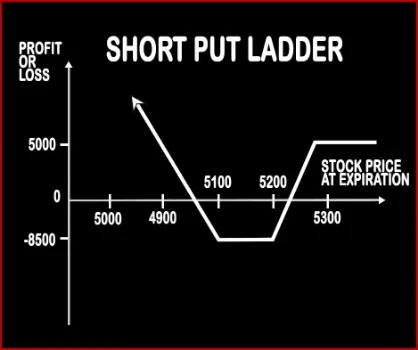
Short Put Ladder Option StrategyThis strategy is implemented when a trader is slightly bearish on the market. A trader is required to be bullish over the volatility in the market. It involves sale of an ITM Put Option and buying of 1 ATM & 1 OTM Put Options. However, the risk associated with this strategy is limited.
|
SHORT PUT BUTTERFLY Vs SHORT PUT LADDER - Details
| SHORT PUT BUTTERFLY | SHORT PUT LADDER | |
|---|---|---|
| Market View | Neutral | Neutral |
| Type (CE/PE) | PE (Put Option) | PE (Put Option) |
| Number Of Positions | 4 | 3 |
| Strategy Level | Advance | Advance |
| Reward Profile | Limited | Unlimited |
| Risk Profile | Limited | Limited |
| Breakeven Point | Upper Breakeven Point = Strike Price of Highest Strike Short Put - Net Premium Received, Lower Breakeven Point = Strike Price of Lowest Strike Short Put + Net Premium Received | Upper Breakeven Point = Strike Price of Short Put - Net Premium Received Lower Breakeven Point = Total Strike Prices of Long Puts - Strike Price of Short Put + Net Premium Received |
SHORT PUT BUTTERFLY Vs SHORT PUT LADDER - When & How to use ?
| SHORT PUT BUTTERFLY | SHORT PUT LADDER | |
|---|---|---|
| Market View | Neutral | Neutral |
| When to use? | In Short Put Butterfly strategy, a trader is neutral in nature and expects the market to remain range bound in the near future. | This strategy is implemented when a trader is slightly bearish on the market. |
| Action | Sell 1 ITM Put, Buy 2 ATM Put, Sell 1 OTM Put | Sell ITM Put Option, Buying 1 ATM & 1 OTM Put Option. |
| Breakeven Point | Upper Breakeven Point = Strike Price of Highest Strike Short Put - Net Premium Received, Lower Breakeven Point = Strike Price of Lowest Strike Short Put + Net Premium Received | Upper Breakeven Point = Strike Price of Short Put - Net Premium Received Lower Breakeven Point = Total Strike Prices of Long Puts - Strike Price of Short Put + Net Premium Received |
SHORT PUT BUTTERFLY Vs SHORT PUT LADDER - Risk & Reward
| SHORT PUT BUTTERFLY | SHORT PUT LADDER | |
|---|---|---|
| Maximum Profit Scenario | Net Premium Received - Commissions Paid | When Price of Underlying < Total Strike Prices of Long Puts - Strike Price of Short Put + Net Premium Received |
| Maximum Loss Scenario | Strike Price of Higher Strike Short Put - Strike Price of Long Put - Net Premium Received + Commissions Paid | Strike Price of Short Put - Strike Price of Higher Strike Long Put - Net Premium Received + Commissions Paid |
| Risk | Limited | Limited |
| Reward | Limited | Unlimited |
SHORT PUT BUTTERFLY Vs SHORT PUT LADDER - Strategy Pros & Cons
| SHORT PUT BUTTERFLY | SHORT PUT LADDER | |
|---|---|---|
| Similar Strategies | Short Condor, Reverse Iron Condor | Strap, Strip |
| Disadvantage | • High risk strategy and may cause huge losses if the price of the underlying stocks falls steeply. • Higher profit is only possible when shares get close to expiration. | • Best to use when you are confident about movement of market. • Small margin required. |
| Advantages | • Benefits from time decay. • Traders can earn more in a rising or range bound scenario. • Benefits from a surge in volatility. | • When there is surge in implied volatility, this strategy can give more profit. • Unlimited downside profit. • Limited risk and unlimited reward strategy. |