Compare Strategies
| LONG PUT LADDER | STRAP | |
|---|---|---|
|
|
|
| About Strategy |
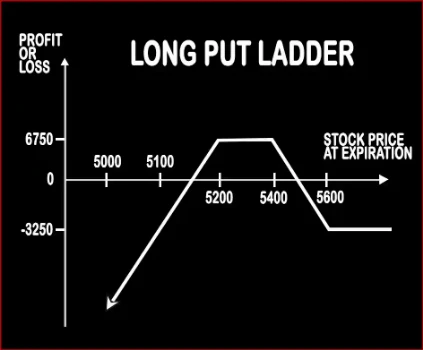
Long Put Ladder Option StrategyLong Put Ladder can be implemented when a trader is slightly bearish on the market and volatility. It involves buying of an ITM Put Option and sale of 1 ATM & 1 OTM Put Options. However, the risk associated with this strategy is unlimited and reward is limited. Risk:< |
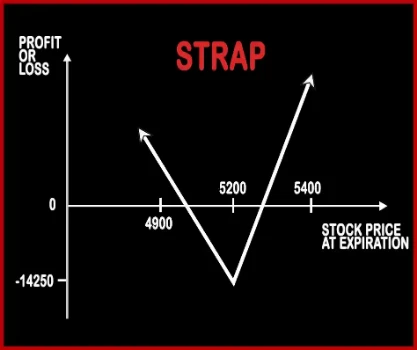
Strap Option StrategyStrap Strategy is similar to Long Straddle, the only difference is the quantity traded. A trader will buy two Call Options and one Put Options. In this strategy, a trader is very bullish on the market and volatility on upside but wants to hedge himself in case the stock doesn’t perform as per his expectations. This strategy will make more profits compared to long straddle sin .. |
LONG PUT LADDER Vs STRAP - Details
| LONG PUT LADDER | STRAP | |
|---|---|---|
| Market View | Neutral | Neutral |
| Type (CE/PE) | PE (Put Option) | CE (Call Option) + PE (Put Option) |
| Number Of Positions | 3 | 3 |
| Strategy Level | Advance | Beginners |
| Reward Profile | Limited | Profit Achieved When Price of Underlying > Strike Price of Calls/Puts + (Net Premium Paid/2) OR Price of Underlying < Strike Price of Calls/Puts - Net Premium Paid |
| Risk Profile | Unlimited | Max Loss Occurs When Price of Underlying = Strike Price of Calls/Puts |
| Breakeven Point | Upper Breakeven Point = Strike Price of Long Put - Net Premium Paid, Lower Breakeven Point = Total Strike Prices of Short Puts - Strike Price of Long Put + Net Premium Paid | Strike Price of Calls/Puts + (Net Premium Paid/2) |
LONG PUT LADDER Vs STRAP - When & How to use ?
| LONG PUT LADDER | STRAP | |
|---|---|---|
| Market View | Neutral | Neutral |
| When to use? | This Strategy can be implemented when a trader is slightly bearish on the market and volatility. | This strategy is used when the investor is bullish on the stock and expects volatility in the near future. |
| Action | Buy 1 ITM Put, Sell 1 ATM Put, Sell 1 OTM Put | Buy 2 ATM Call Option, Buy 1 ATM Put Option |
| Breakeven Point | Upper Breakeven Point = Strike Price of Long Put - Net Premium Paid, Lower Breakeven Point = Total Strike Prices of Short Puts - Strike Price of Long Put + Net Premium Paid | Strike Price of Calls/Puts + (Net Premium Paid/2) |
LONG PUT LADDER Vs STRAP - Risk & Reward
| LONG PUT LADDER | STRAP | |
|---|---|---|
| Maximum Profit Scenario | Strike Price of Long Put - Strike Price of Higher Strike Short Put - Net Premium Paid - Commissions Paid | UNLIMITED |
| Maximum Loss Scenario | When Price of Underlying < Total Strike Prices of Short Puts - Strike Price of Long Put + Net Premium Paid | Net Premium Paid |
| Risk | Unlimited | Limited |
| Reward | Limited | Unlimited |
LONG PUT LADDER Vs STRAP - Strategy Pros & Cons
| LONG PUT LADDER | STRAP | |
|---|---|---|
| Similar Strategies | Short Strangle (Sell Strangle), Short Straddle (Sell Straddle) | Strip, Short Put Ladder, Short Call Ladder |
| Disadvantage | • Unlimited risk. • Margin required. | • To generate profit, there should be significant change in share price. • Expensive strategy. |
| Advantages | • Reduces capital outlay of bear put spread. • Wider maximum profit zone. • When there is decrease in implied volatility, this strategy can give profit. | • Limited loss. • If share prices are moving then traders can book unlimited profit. • A trader can still book profit if the underlying falls substantially. |