Unveiling Market Insights: Exploring Volume Indicators and Volume Analysis
What is a Volume Indicator?
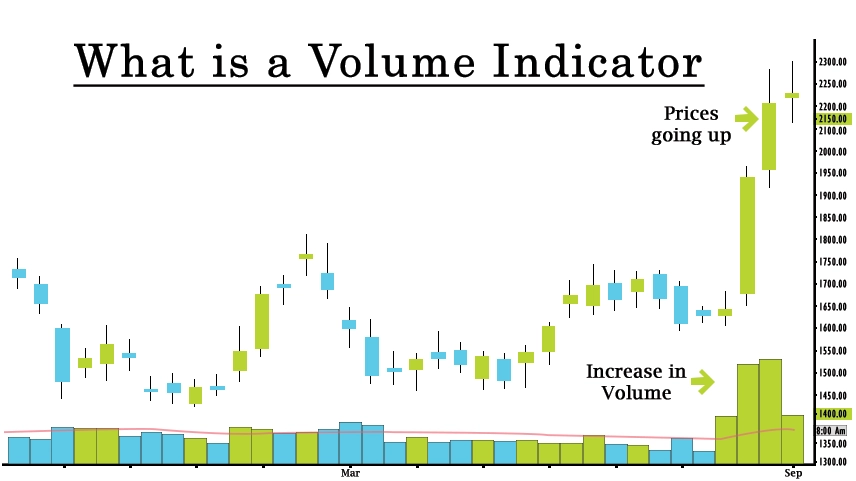
A volume indicator, in the context of financial markets and trading, is a tool used to analyze and display the trading volume of a particular asset, such as stocks, commodities, or cryptocurrencies, over a specific period of time. relative volume indicator Trading volume represents the overall count of shares, contracts, or units of an asset that have been purchased or sold within a specific period, trading volume analysis usually within a single day or trading session. Volume indicators are widely used by traders and analysts to gain insights into the strength and significance of price movements and trends.
How they work
Volume indicators work by analyzing and displaying the amount of trading activity (buying and selling) for a financial asset over a specific time frame, helping traders identify trends, confirm price movements, and assess market strength. They provide insights into the market's level of participation different volume indicators and can signal potential changes in price direction based on changes in trading volume, how volume works.
1. Basic Principle: The basic principle behind volume indicators is that trading volume often accompanies price movements. When a price moves significantly in one direction, higher trading volume can indicate strong market participation and interest in that movement.
2. Types of Volume Indicators: There are several types of volume indicators, with some of the most common ones being:
• Volume Bars: In traditional price charts, cost volume analysis bars or candles represent both price and volume information. The height or thickness of the bars/candles reflects the trading volume during that period.
• Volume Moving Averages: These are moving averages applied to trading volume. They smooth out volume data to help identify trends and changes in trading activity over time.
• On-Balance-Volume (OBV): This indicator calculates a running total of volume based on whether the price closes higher or lower than the previous day. It aims to identify the accumulation or distribution of an asset.
• Money Flow Index (MFI): MFI takes into account both price and volume to measure the strength and direction of money flowing in and out of an asset. It is often used to identify potential overbought or oversold conditions.
• Chaikin Money Flow: Similar to MFI, this indicator uses both price and volume data to measure the flow of money into or out of an asset. It's especially useful for confirming trends and spotting potential reversals.
• Volume Profile: This indicator displays a vertical histogram on the price chart, indicating the volume traded at various price levels. It helps identify important support and resistance levels.
• Interpretation: When interpreting volume indicators, traders look for patterns and divergences. For example, if a price is rising and the corresponding volume is also increasing, it can be seen as a confirmation of the uptrend's strength. Conversely, if the price is rising but the volume is decreasing, it might indicate a weakening trend.
• Confirmation and Divergence: Volume indicators can be used to confirm or diverge from price movements. For example, if a price is making higher highs while the volume is decreasing, it might suggest that the uptrend is losing momentum and a reversal could be imminent.
Volume Analysis
Volume indicator analysis is a method used in financial markets to study and interpret trading volume patterns to gain insights into market trends and potential price movements. By examining the volume of trades accompanying price changes, traders can assess market strength, confirm trends, volume analysis for trading and identify potential reversals or breakouts. Volume analysis helps traders understand the level of market participation and the significance of price movements based on the amount of trading activity.
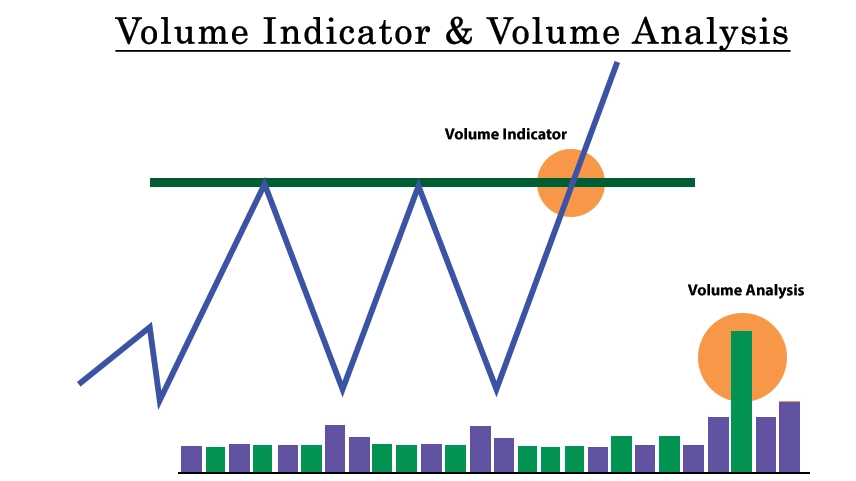
Volume Indicator and Volume Analysis
The difference between a volume indicator and a volume analysis lies in their focus and purpose.
• Volume Indicator - A indicator volume is a specific tool or metric used to quantitatively represent trading volume on a price chart. Examples include On-Balance-Volume (OBV), Money Flow Index (MFI), and Volume Moving Averages. These indicators provide visual and mathematical representations of trading volume, helping traders identify patterns and trends related to volume and its relationship with price movements.
• Volume Analysis - Volume analysis, on the other hand, refers to the broader practice of studying and interpreting trading volume patterns and their implications for market behavior. It involves analyzing not only the specific volume indicator values but also the context in which they occur. Volume analysis encompasses a wider range of techniques, including observing volume spikes, comparing volume across timeframes, analyzing volume alongside price patterns, rate volume analysis, and identifying divergences between price and volume movements.
0 comments