Relative Strength Index (RSI) : A Powerful Indicator for Market Analysis
What is Relative Strength Index (RSI)
The Relative Strength Index (RSI) is a widely used technical analysis tool in the field of finance and investment. It is designed to measure the strength and momentum of price movements in a financial instrument, such as a stock, commodity, or currency pair. The RSI is a bounded oscillator that fluctuates between 0 and 100, providing traders and investors with valuable insights into whether an asset is overbought or oversold.
The relative strength index means RSI calculates the relative strength of price gains versus price losses over a specified period, typically 14 trading days. It compares the average gain and average loss during this time frame and produces a numerical value that reflects the internal strength of the asset. The RSI formula uses a smoothing function to normalize the results and make it easier to interpret.
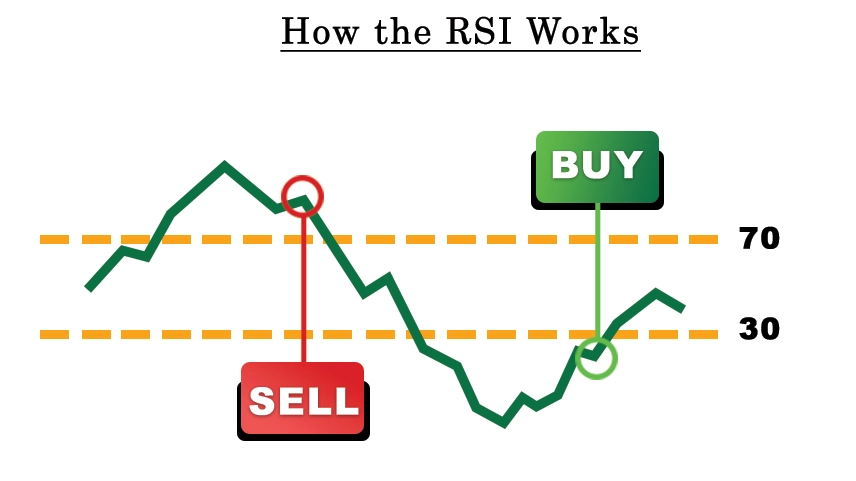
When the RSI value exceeds 70, it is generally considered an indication that the asset is overbought and may be due for a price correction or reversal. On the other hand, an RSI value below 30 suggests that the asset is oversold, potentially signaling an upcoming price rebound. Traders often use these levels as triggers for buying or selling decisions, looking for opportunities to enter or exit positions.
The RSI is also used to identify bullish or bearish divergences, which occur when the price of an asset moves in the opposite direction of the RSI. Bullish divergence suggests a potential upward reversal, while bearish divergence may indicate an upcoming downward reversal. Traders use these signals in conjunction with other technical indicators and analysis tools to make informed trading decisions.
How the RSI works | RSI Calculated
The Relative Strength Index (RSI) works by analyzing the internal strength and momentum of price movements in a financial instrument. It does this by comparing the average gains and losses over a specified period, typically 14 trading days, and generating a numerical value between 0 and 100.
The relative strength index formula is calculated using the following formula:
RSI = 100 - (100 / (1 + RS))
Where: RS = Average of x-day's up closes / Average of x-day's down closes
To calculate the RSI, the following steps are typically followed:
1. Determine the price gains and losses: For each trading period within the specified timeframe, the difference between the closing price and the previous closing price is calculated. If the difference is positive, it represents a price gain, while a negative difference represents a price loss.
2. Calculate the average gain and average loss: The average gains and losses are calculated by summing up the gains and losses over the specified period and dividing them by the number of periods. The most common approach is to use a simple moving average (SMA) formula to calculate these averages, calculate relative strength index.
3. Calculate the relative strength (RS): The relative strength is the ratio of the average gain to the average loss. It provides a measure of the internal strength of the asset based on recent price movements. The formula for relative strength index calculation RS is RS = Average Gain / Average Loss, relative strength index calculation example.
4. Calculate the RSI: The RSI is derived from the relative strength and is calculated using the following formula: RSI = 100 - (100 / (1 + RS)). This formula of relative strength index ensures that the RSI remains bounded between 0 and 100.
Once the RSI value is obtained, it can be interpreted to assess the overbought or oversold conditions of the asset. Values above 70 typically indicate overbought conditions, suggesting a potential price correction or reversal. Values below 30 indicate oversold conditions, potentially signaling a price rebound.
Traders and investors use the RSI as a tool to identify potential entry or exit points. They look for RSI values that diverge from the prevailing price trend or reach extreme levels, using these signals in conjunction with other technical indicators and analysis methods to make informed trading decisions.
Why RSI Important
RSI Relative strength index data is important in financial analysis for several reasons:
1. Identifying overbought and oversold conditions: RSI helps identify when an asset is overbought or oversold. When the RSI value is above 70, it suggests that the asset is overbought and may be due for a price correction or a downward trend. when the RSI reading falls below 30, it signifies that the asset has reached an oversold condition, suggesting a potential opportunity for a price recovery or an upward movement in the near future. These levels can be used as potential buying or selling opportunities.
2. Assessing trend strength and momentum: RSI provides insights into the strength and momentum of a price trend. A rising RSI indicates that the buying pressure is increasing, while a declining RSI rules suggests that selling pressure is increasing. Traders and analysts use RSI to gauge the underlying strength of a trend and make informed decisions about entering or exiting positions.
3. Divergence signals: RSI can help identify divergences between the price and the indicator. Bullish divergence occurs when the price makes lower lows while the RSI forms higher lows, indicating a potential reversal to the upside. On the other hand, bearish divergence occurs when the price makes higher highs while the RSI forms lower highs, suggesting a potential reversal to the downside. These divergences can be early indications of trend reversals and can assist traders in making timely decisions.
4. Confirmation of price patterns: RSI can confirm or provide additional insights into various price patterns, such as support and resistance levels, trendline breakouts, and chart patterns. When the RSI validates the price pattern, it adds confidence to the analysis and helps traders in making more informed trading decisions.
5. Risk management: RSI can be used as a risk management tool. Traders can set stop-loss levels or take-profit levels based on RSI signals to manage their risk exposure. Relative strength index example if an asset is overbought according to RSI, a trader may consider placing a tight stop-loss to protect against a potential price reversal.
How to use the RSI indicator?
- RSI helps predict price behavior by indicating potential reversals or corrections.
- It validates trends and identifies possible trend reversals.
- It points out overbought and oversold securities, highlighting potential buying or selling opportunities.
- RSI helps identify buy and sell signals for trading decisions, use of rsi indicator
- It is used in combination with other technical analysis tools to develop a comprehensive trading strategy, and relative strength index strategy.
Using RSI With Trends
When using the Relative Strength Index (RSI) with trends:
The RSI can be helpful in confirming and validating trends. In an uptrend, the RSI typically stays above 50, reflecting the strength of buying pressure. Traders may look for opportunities to enter long positions when the RSI pulls back to or near the 50 level, indicating a potential retracement within the ongoing uptrend.
In a downtrend, the RSI generally stays below 50, reflecting the strength of selling pressure. Traders may consider short positions when the RSI rallies to or near the 50 level, suggesting a potential retracement within the ongoing downtrend.
By combining trend analysis with RSI readings, traders can enhance their understanding of the overall market direction and potential entry or exit points within the existing trend. This approach helps traders align their strategies with the prevailing trend and improve the overall accuracy of their trading decisions.
RSI Overbought or Oversold Condition
The Relative Strength Index (RSI) is commonly used to identify overbought and oversold conditions in the market. When the RSI reaches or exceeds the 70 levels, it indicates that the asset may be overbought, meaning that its price has increased significantly and may be due for a downward correction or reversal. This suggests that there may be an imbalance between buying and selling pressure, potentially leading to a price decline. RSI overbought oversold Traders often interpret this as a signal to consider selling or taking profits.
Conversely, when the RSI falls to or below the 30 levels, it suggests that the asset may be oversold. This means that the price has decreased significantly and may be due for an upward correction or reversal. It indicates a potential imbalance between selling and buying pressure, which could lead to a price increase. Traders may view this as a signal to consider buying or entering long positions.
Example
Let's take an example to illustrate the best relative strength index RSI overbought and oversold conditions,
Suppose we are analyzing the price of a stock using a 14-day RSI. The stock has been on an uptrend for a while, and its RSI has been consistently above 50, indicating strong buying pressure.
- Overbought Condition: As the stock continues to rise, its RSI gradually reaches or exceeds the 70 levels. This suggests that the stock may be overbought, meaning it has experienced a significant price increase and could potentially be due for a downward correction. Traders who observe this overbought condition may consider selling or taking profits, expecting a possible pullback or price reversal.
- Oversold Condition: After a period of price decline or consolidation, the stock's RSI falls to or below the 30 levels. This indicates that the stock may be oversold, implying that it has experienced a significant price decrease and could potentially be due for an upward correction or rebound. Traders who observe this oversold condition may view it as a potential buying opportunity, considering entering long positions or adding to existing positions.
RSI Ranges
During trends, the benefits of relative strength index RSI readings often exhibit specific behaviors within a defined range. In an uptrend, the RSI tends to stay above 30 and frequently reaches or exceeds 70. However, in a downtrend, it is infrequent for the RSI to exceed the 70 level, and it is more common for the indicator to retreat to 30 or even lower levels.
These observations provide valuable insights for traders to assess trend strength and identify potential reversals. For instance, if during an uptrend, the RSI fails to reach 70 on several consecutive price swings but subsequently drops below 30, it indicates a weakening trend that might be reversing downwards.
By monitoring the RSI's behavior within these ranges, traders can gauge the sustainability of a trend and anticipate possible shifts in price momentum. These guidelines serve as useful tools to aid in decision-making and enhance the effectiveness of trading strategies.
RSI Divergence Indicator
Best relative strength indicator RSI divergence is a popular technical indicator used to identify potential trend reversals in the market. It occurs when there is a discrepancy or divergence between the price action of an asset and the RSI indicator.
- There are two types of RSI divergence: Bullish Divergence: Bullish divergence happens when the price keeps going down to make new lows, but at the same time, the RSI indicator starts making higher lows. This suggests that even though the price is declining, the momentum indicated by the RSI is increasing. It can be an early indication of a potential trend reversal to the upside. Traders often interpret bullish divergence as a signal to consider buying or going long.
- Bearish Divergence: Bearish divergence occurs when the price forms higher highs while the RSI forms lower highs. This indicates that despite the price rising, the momentum indicated by the RSI is decreasing. It can be a warning sign of a potential trend reversal to the downside. Traders often interpret bearish divergence as a signal to consider selling or going short.
RSI divergence is typically used in conjunction with other technical analysis tools and confirmation indicators to increase the probability of accurate predictions. It helps traders spot potential trend reversals before they become evident in the price action alone.
Positive and Negative RSI Reversals
Positive and negative RSI reversals are concepts closely related to RSI divergence rsi positive reversal and are used to identify potential trend reversals in the market. They are based on changes in the direction of the RSI indicator itself.
- Positive RSI Reversal: A positive RSI reversal occurs when the RSI forms a higher low while the price forms a lower low. In other words, the RSI shows an upward reversal while the price continues to decline. This can be a bullish signal, indicating a potential trend reversal to the upside. It suggests that the selling pressure is weakening and buying momentum may be building, potentially leading to an upward move in prices.
- Negative RSI Reversal: Conversely, a negative RSI reversal occurs when the RSI forms a lower high while the price forms a higher high. Here, the RSI shows a downward reversal while the price continues to rise. This can be a bearish signal, suggesting a potential trend reversal to the downside. It indicates that the buying momentum is diminishing and selling pressure may be increasing, potentially leading to a downward move in prices.
Positive and negative RSI reversals help traders identify shifts in momentum and anticipate potential trend reversals, positive and negative risk. They provide valuable insights into the underlying strength or weakness of a trend. However, it's important to confirm these reversals with other technical analysis tools, such as trendlines, chart patterns, or volume indicators, to increase the reliability of the signals.
RSI Swing rejections
A bullish failure swing occurs when the RSI indicator exhibits the following sequence of events:
1. RSI drops into the oversold territory: The RSI value falls below the 30 level, indicating an oversold condition in the market. This suggests that selling pressure has pushed the RSI swing rejection to a relatively low level.
2. RSI bounces back above 30: After reaching oversold territory, the RSI starts to rise and crosses back above the 30 levels. This bounces back above 30 signifies a potential shift in momentum towards the upside.
3. RSI establishes another dip without reaching oversold territory: Instead of dropping below 30 again, the RSI retraces or pulls back but remains above the oversold threshold. This demonstrates that the selling pressure is subsiding, and the bulls are gaining strength.
4. RSI breaks its prior high: Finally, the RSI surpasses its previous peak or high point, confirming the bullish failure swing. This indicates that the buying pressure has intensified, potentially leading to an upward price movement.
A bullish failure swing based on RSI suggests a potential bullish reversal or upward trend continuation. It signifies that the selling pressure has been exhausted, and buyers are gaining control of the market.
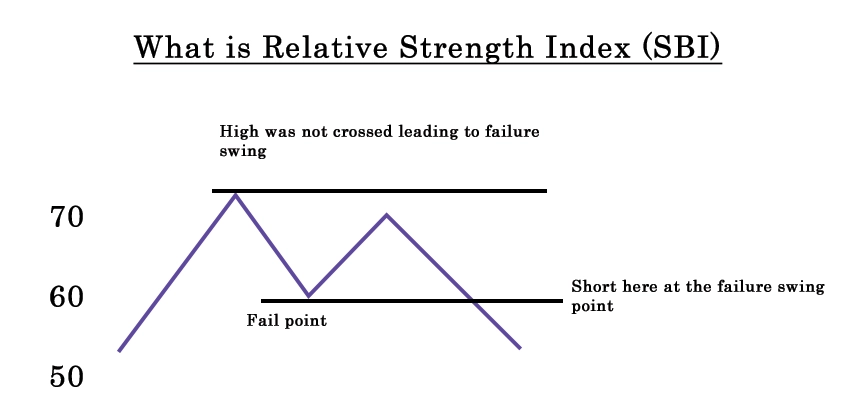
The bearish failure swing forms when:
Bearish failure swing swing failure using the RSI indicator. Here's a recap:
1. RSI climbs into the overbought territory: The RSI value rises above the 70 levels, indicating an overbought condition in the market. This suggests that the buying pressure has pushed the RSI to a relatively high level.
2. RSI drops back below 70: After reaching overbought territory, the RSI starts to decline and falls back below the 70 levels. This drops below 70 signifies a potential shift in momentum towards the downside.
3. RSI establishes another high without reaching overbought territory: Instead of surpassing 70 again, the RSI retraces or moves higher but remains below the overbought threshold. This indicates that the buying pressure is weakening, and the bears may be gaining control.
4. RSI breaks its prior low: Finally, the RSI falls below its previous low point, confirming the bearish failure swing. This indicates that the selling pressure has intensified, potentially leading to a downward price movement.
When using the bearish failure swing signal, it is generally more reliable when it aligns with the long-term trend. In other words, if the overall trend in the market is downward, bearish signals like the failure swing are more likely to be accurate and have a higher probability of success. Additionally, bearish signals during downward trends are less prone to false alarms.
Conclusion
The Relative Strength Index (RSI) is a valuable technical indicator that provides insights into the price behavior of an asset. It is used by traders to predict price movements, validate trends, identify overbought and oversold conditions, and generate buy and sell signals.
The RSI is important because it helps traders gauge the strength and momentum of a trend, spot potential reversals, and develop trading strategies. By analyzing RSI divergence, positive and negative reversals, swing rejections, and failure swings, traders can make more informed decisions about entering or exiting positions.
Note that while the RSI can be a powerful tool, it should not be relied upon in isolation. It is best used in conjunction with other technical analysis tools, such as chart patterns, trendlines, and volume indicators, to increase the accuracy of predictions.
Traders should also consider the overall market conditions, perform a thorough analysis, and practice proper risk management techniques when incorporating the RSI into their trading strategies. By combining multiple sources of information, traders can gain a more comprehensive understanding of the market and make more confident trading decisions.
0 comments