Percentage Price Oscillator Indicator: Calculation, Formula, Work and Conclusion
What is Percentage Price Oscillator indicator
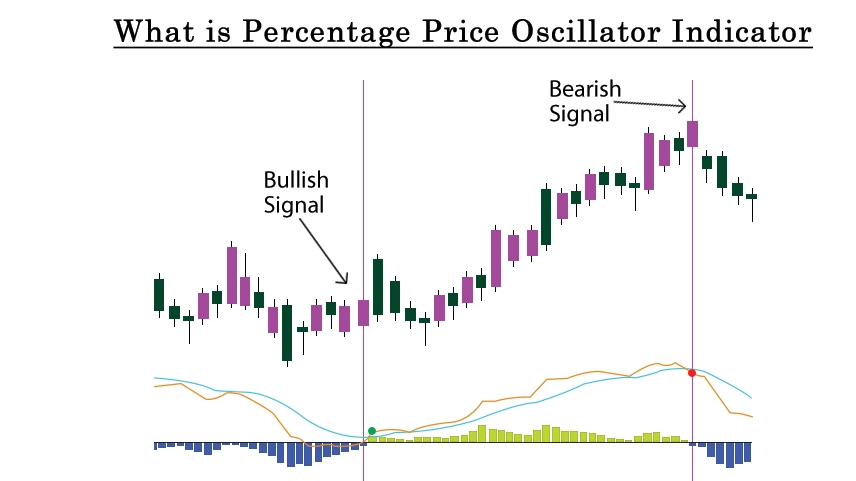
The Percentage Price Oscillator Indicator (PPO) is a technical analysis tool used to measure the momentum of a security's price in relation to a specific time period. It is like the Moving Average Convergence Divergence (MACD) indicator but is presented as a percentage rather than an absolute value.
What is price oscillator indicator? It measures the percentage difference between two exponential moving averages (EMAs) of different time periods, typically a short-term EMA and a long-term EMA. By comparing these EMAs, percentage price oscillator ppo indicator PPO reveals trends and potential turning points in the price action of a financial instrument. When the price percentage oscillator PPO crosses above zero, it suggests bullish momentum, signaling potential buying opportunities, while a cross below zero indicates bearish momentum, suggesting potential selling opportunities.
Calculation
Calculation of Percentage Price Oscillator Indicator here are some points how its calculated.
1. Calculate the short-term exponential moving average (EMA) of the price.
2. Calculate the long-term exponential moving average (EMA) of the price.
3. Subtract the long-term EMA from the short-term EMA.
4. Divide the result by the long-term EMA and multiply by 100 to get the percentage.
Formula – Mathematically, it can be representing as

Traders use the PPO to identify trend changes, overbought or oversold conditions, and potential buy or sell signals. When the PPO crosses above the zero line, it's considered bullish, indicating a potential buy signal, while a cross below the zero line is bearish, signaling a potential sell.
How the Percentage Price Oscillator Works
The Percentage Price Oscillator (PPO) works by comparing two exponential moving averages (EMAs) of Security’s price to identify trends and trading opportunities. Here’s How it works.
1. The PPO first calculates two EMAs, one based on short term period and other based on a longer-term period. These EMAs are calculated based on the closing prices of the security over the specified time periods.
2. Once the EMAs are calculated, the PPO subtracts the longer-term EMA from the shorter-term EMA. This calculation gives a numerical value representing the difference between the two moving averages.
3. The absolute difference obtained from the subtraction is then normalized as a percentage of the longer-term EMA. This normalization process is achieved by dividing the difference by the longer-term EMA and multiplying by 100. This step transforms the absolute difference into a percentage value, which is easier to interpret and compare across different securities and timeframes.
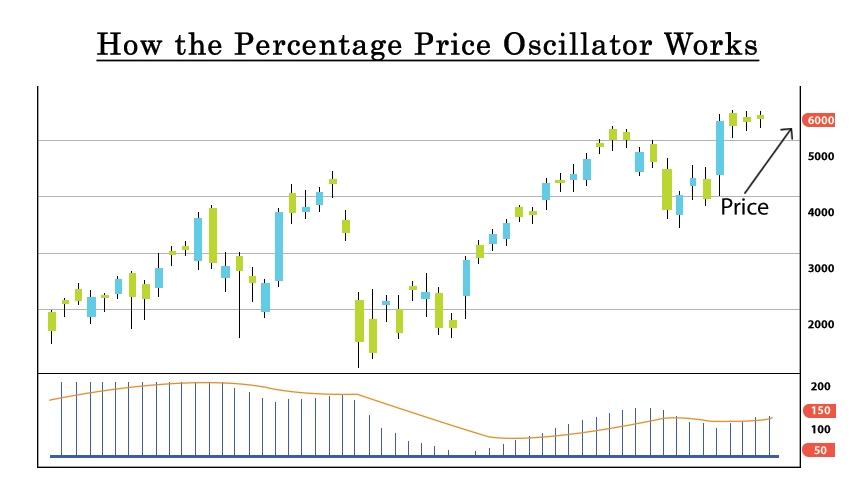
4. Percentage value is plotted on a chart as the PPO line. Traders typically use this line to identify trends and potential reversal points. Positive values the suggest bullish momentum, while negative values indicate bearish momentum.
5. Signal Line and Divergence Some traders also use a signal line, often a 9-day EMA of the PPO, to generate buy and sell signals. When the PPO line crosses above the signal line, it may signal a buying opportunity, and when it crosses below, it may suggest a selling opportunity.
Conclusion
Percentage Price Oscillator “PPO” is a powerful technical analysis tool that helps traders & investors assess the momentum and direction of the security's price movements. By comparing two exponential moving averages (EMAs) and expressing the difference as a percentage, the PPO generates a single line that oscillates above and below zero, indicating bullish or bearish momentum. Traders use the PPO to identify trends, potential buying or selling opportunities, and divergence patterns between the indicator and price action. With its ability to provide valuable insights into market dynamics, the PPO aids traders in making more informed decisions, ultimately enhancing their trading strategies and outcomes in the financial markets.
0 comments