On Balance Volume Indicator: Uses, Formula, Limitations, Conclusion
What is the OBV on balance volume Indicator?
The on-balance volume (OBV) is a technical analysis indicator that attempts to gauge market trends by analyzing the relationship between the volume of trades and asset prices.
The basic idea behind OBV is that volume precedes price movements. The concept is that, in general, when the volume increases significantly, it indicates strong buying or selling pressure, which can precede a price change. OBV accumulates volume in a running total, adding the volume on up days and subtracting it on down days.
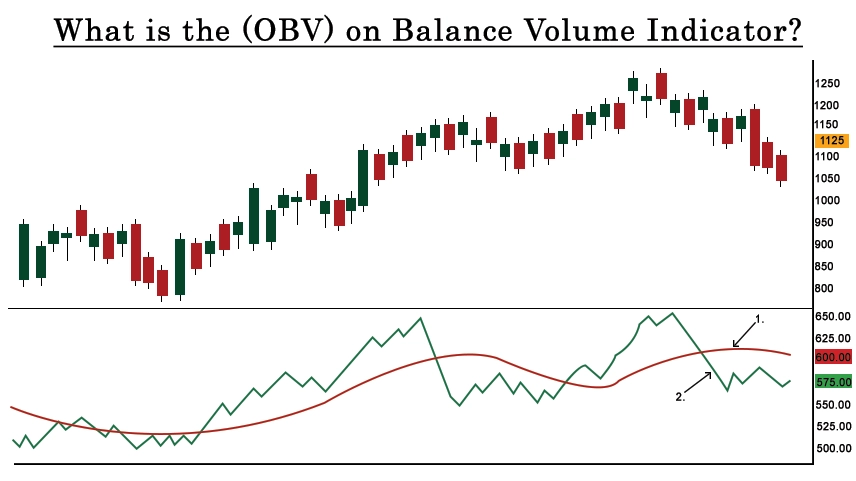
If the price closes higher than the previous close, the day's volume is added to the cumulative OBV. If the price closes lower than the previous close, the day's volume is subtracted. This cumulative total is used to confirm the strength of a trend on balance volume indicator strategy, Rising OBV on balance volume negative confirms an uptrend, while falling OBV confirms a downtrend.
It's a useful tool for traders and analysts to confirm the strength of a price move and identify potential trend reversals. If the price is making new highs, but OBV is not confirming those highs, it might signal a potential weakness in the uptrend.
How to use On Balance Volume Indicator
Using the On-Balance Volume (OBV) indicator involves interpreting its movements to identify potential trends and reversals. Here's a step-by-step guide on how to use OBV:
1. Trend Confirmation:
• In an uptrend, the OBV should ideally be making new highs along with the rising price. This confirms the strength of the upward trend.
• In a downtrend, the OBV on-balance volume indicator (obv) should be making new lows along with falling prices, indicating strong selling pressure.
2. Divergence Signals:
• ivergence between OBV and price movements can be a powerful signal. If prices are rising to new highs, but OBV is not confirming those highs (it's not making new highs), it could be a sign of weakening bullish momentum.
• Conversely, in a downtrend, if prices are making new lows but OBV is not confirming those lows, it could signal a potential weakening of the bearish trend.
3. Volume Confirmation:
• When there's a significant price movement, the OBV should ideally confirm that movement by experiencing a corresponding increase in volume. If prices are rising, and OBV is also rising, it suggests strong buying interest.
4. Trend Reversals:
• Reversals can be signaled by divergences or significant changes in OBV. For example, if prices are making new highs, but OBV on balance volume examples starts to decrease, it may indicate that buying interest is waning, potentially signaling a reversal.
5. Watch for Breakouts:
• OBV can be used to confirm breakout movements. When prices break above a resistance level, a corresponding increase in OBV can confirm the strength of the breakout.
6. Use in Conjunction with Price Analysis:
• It's essential to use OBV in conjunction with other technical analysis tools and price action analysis. It's a supportive indicator rather than a standalone tool.
7. Understand Market Sentiment:
• Rising OBV indicates accumulation (buying interest), while falling OBV indicates distribution (selling interest). Understanding market sentiment through OBV can provide insights into the strength of trends.
Formula for On-Balance Volume (OBV)
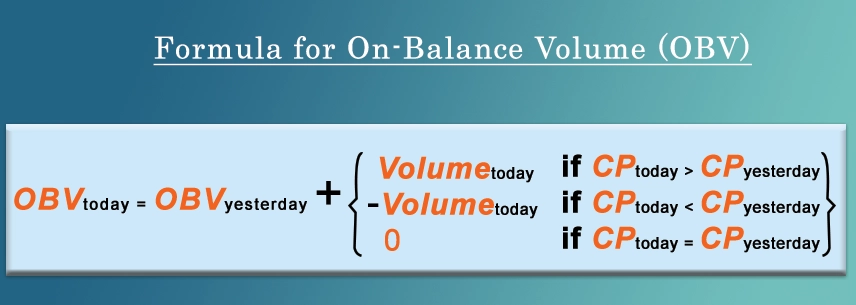
The on balance volume indicator formula (OBV) is calculated using a simple formula that takes into account the daily trading volume and the direction of the closing price movement. Here's the basic formula:
OBVt =OBVt−1+Volume t
Where:
• OBVt is the On-Balance Volume at time t.
• OBVt−1 is the On-Balance Volume at the previous time period (t−1).
• Volume t is the trading volume at time t.
The direction of the price movement determines how the volume is added or subtracted. If the closing price is higher than the previous day's closing price, the entire volume of the day is added to the OBV. If the closing price is lower, the entire volume is subtracted. If the closing price is unchanged, the volume is not added or subtracted.
In mathematical terms, it can be expressed as:
OBV t-1 + VOLUME t If CLOSE t > CLOSE t-1
OBV t-1 - VOLUME t if CLOSE t< CLOSEt-1
OBV t-1 if CLOSE t = CLOSE t-1
Here, Close t is the closing price at time t, and Close t −1 is the closing price at the previous time period (t−1).
Challenges of using the on balance Indicator
Conclusion
In conclusion, the On-Balance Volume (OBV) indicator is a valuable tool in technical analysis, offering insights into market trends and potential reversals by analyzing the relationship between price movements and trading volume. Its benefits include trend confirmation, divergence signals, and market sentiment insights. However, traders should be aware of its limitations, such as sensitivity to price volatility, lagging nature, and potential distortions in low-liquidity markets. Like any tool, OBV is most effective when used in conjunction with other indicators and analysis methods, forming part of a comprehensive trading strategy. It's essential to consider the broader market context and exercise caution, recognizing that no single indicator guarantees accurate predictions in complex and dynamic financial markets.
0 comments