Moving Averages: Granville's Rules for Buying and Selling, and Their Weak Points
What are Moving averages?
Moving averages are statistical calculations used to analyze and smooth out data points over a specific period of time. They provide a moving representation of the average value of a dataset by considering a sliding window of data points.
The concept behind moving averages is to reduce the impact of short-term fluctuations or noise in the data and identify underlying trends or patterns. By calculating the average value over a specified number of data points, moving averages help to reveal the overall direction or behavior of the data.
Moving averages come in various forms, and types of moving averages, but the two most popular ones are the Simple Moving Average (SMA) and the Exponential Moving Average (EMA).
1. Simple Moving Average (SMA): The SMA is calculated by adding up a specified number of data points and dividing the sum by the number of points. For example, if you want to calculate a 5-day SMA, you would add up the values of the past five days and divide the sum by 5. Each new calculation involves dropping the oldest data point and including the most recent one.
2. Exponential Moving Average (EMA): The EMA gives more weight to recent data points, making it more responsive to changes in the underlying data It is calculated using a formula that takes into account historical EMA values and current values. The EMA is often used when there is a need to emphasize recent data and react quickly to changes in the data series.
simple moving averages are commonly used in various fields, including finance, stock market analysis, time series forecasting, and signal processing. They help to identify trends, support and resistance levels, and potential turning points in the data.
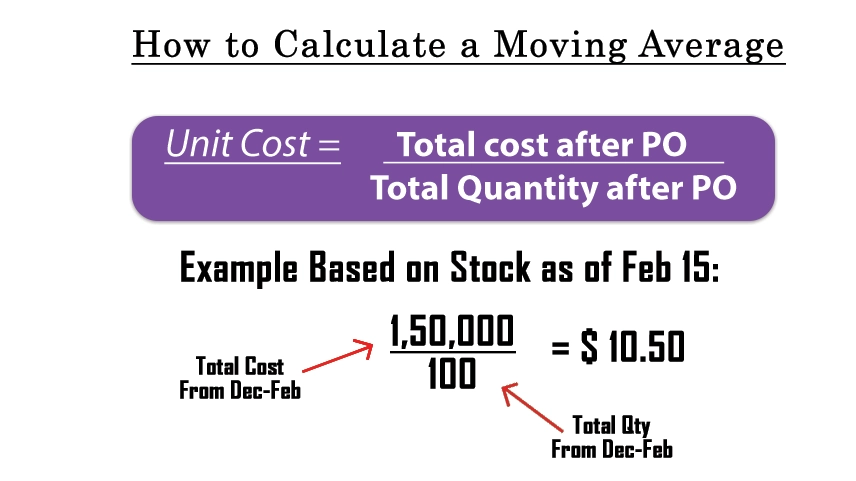
How to calculate a moving average
A simple moving average is called a "simple moving average".
The "simple" moving average is calculated by adding the most recent "n" security price periods and dividing by "n". For example, add a 5 or 25-day closing price to securities and divide by 5 or 25. The result is the security's average price over the last 5 days or 25 days. There are 5 days in a week and 25 days in a month. The average calculates the rising and falling values in the loop and can also work on eliminating time-varying values. Weekly charts usually use weeks 13, 26, and 52. This eliminates seasonal changes for quarters, semi-period, and years. In the monthly chart, 12 months, 24 months, and 60 months are often used. At 60 months, the so-called "Kitchin cycle", which represents short-delay copy times, is removed. The moving average analysis can usually be found by attaching it to a price chart such as a chart or other document.
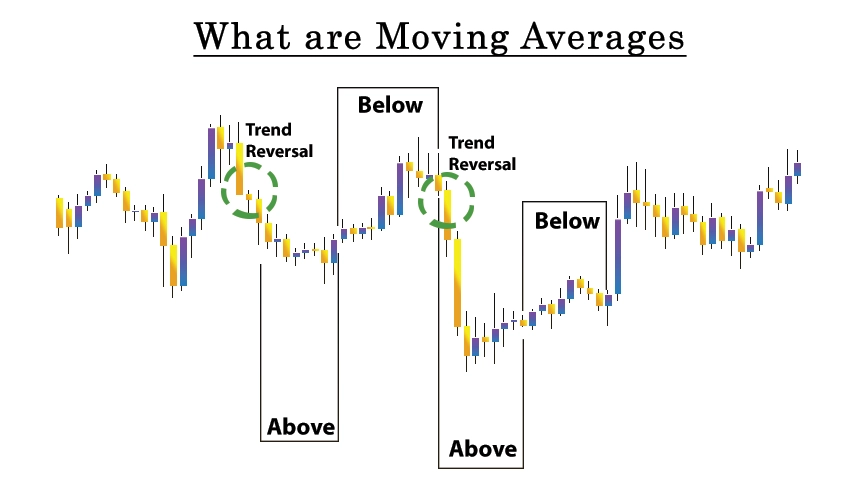
How to use
See Figure 1 below; If the moving average increases from left to right, it represents an increase of. See #2; If the price exceeds the rising average, the speed has increased. look no 3; If the price drops below the average line, it means the trend is slow. Then, if the average moves to and goes down, it means it is entering a downtrend. Or vice versa, cf. #4; If the moving average is falling from left to right, indicates a downtrend. see #5; If the price rise moves to the lower average, it means that the fall of is faster. look no 6; If the price crosses the middle line, it means the decline is slowing down. Then, if the average moves to and tops out, it means entering an uptrend. Above is an analysis of price charts and best-moving averages. Price action repeats with this change.
Granville’s Rule (buying)
Based on the relationship between price and the 200-day moving average, Granville developed 8 trading rules.
4 signals for buying are as follows:
1. At the time of the moving average sideways or upward after falling down, & then the stock price is higher than the moving average,
2. The stock price goes lower than the uptrend moving average accuracy,
3. The stock price is over the uptrend moving average falls toward the moving average and then again begins to rise without recording the ¬figures below the moving average,
4. The stock price becomes far below the downtrend moving average.
Granville’s Rule (selling)
4 signals for selling are as follows:
5. When the moving average moves sideways or down after rising and then the stock price falls below the moving average.
6. Stock price uptrend above moving average.
7. The stock price rises below the drop to the mean and then starts to drop again without posting an above-average figure.
8. The stock price is well above the uptrend moving average. There are many examples of the above 8 characters. But you need to be careful about "false signs" when you only trust these signs. A "false signal" is a buy or sell signal that doesn't actually pay.
Weak point
The simple moving average has a lag time device that is calculated by half time. If the line is short, it should not be a problem, but if it is a long line, this situation cannot be ignored.
For example, the volatility of the 200-day slow-moving average used by Granville is about 100 days behind. In other words, the trend shown by the current 200-day moving average is the trend from 100 days ago.
It is difficult for investors to evaluate the market based on data from the last 100 days. If investors want to know the right time to invest, the calculation cycle should be shorter, but the shorter the cycle, the more ineffective the change. This increase makes it difficult for investors to keep the difference. There is both good and bad.
Two moving averages of different terms
Price movements sometimes involve regular fluctuations. A price that crosses the moving average does not always indicate a change. Usually, it is better to use two moves. This technique is called a double crossover method. The longer calculation time is called the long-term average (long-term line) and the shorter-term average (short-term line). Sometimes a moving average (timeline) is used.
In an uptrend, the price appears from top to bottom, short term and long term. Even if the price falls in an uptrend, the short-term and long-term lines often act as bearish support. This means that the price stops at this level and then rises, or even if the short line falls, the long line is tied to the support line and the price stops at that level.
In a downtrend, the price appears from the bottom up for the short term and the long term. If the price goes up, the short and long lines often turn into resistance lines. This means that the price rises and then falls at this level, or even if the short line rises, the long line becomes a resistance line and the price rises at this level.
0 comments