Exploring Standard Deviation: Uses, Limitations, and Examples in Data Analysis
What is Standard Deviation
Standard deviation is a tool in statistics that helps us understand how much the numbers in a group are spread out from the average. It provides a way to understand how spread out the values in a dataset are around the mean (average) value. In other words, it gives you an idea of how much individual data points deviate from the average.
Mathematically, the standard deviation is calculated using the following steps:
1. Calculate the mean (average) of the dataset.
2. For each data point, subtract the mean from the data point and square the result.
3. Calculate the average of the squared differences from step 2. This is often called the variance.
4. To find the standard deviation, you just need to find the square root of the variance.
The standard deviation is expressed in the same unit as the original data and provides a measure of the typical distance between data points and the mean. If the standard deviation is small, the numbers are close to the average. If it's large, the numbers are more spread out from the average. Standard deviation is commonly used in various fields, including statistics, finance, science, and engineering, to assess the variability and reliability of data. It helps in understanding the consistency and stability of measurements or observations and is a fundamental tool for analyzing and interpreting data distributions.
Standard Deviation Uses
Standard deviation has several important uses in various fields:
1. Assessing Data Spread: Standard deviation helps in understanding the dispersion or spread of data points around the mean. A higher standard deviation indicates greater variability, while a lower standard deviation suggests that data points are closer to the mean.
2. Risk Assessment in Finance: In finance, standard deviation is used as a measure of risk or volatility in investment returns. Stocks or other financial instruments with higher standard deviations tend to have more unpredictable price movements.
3. Quality Control: In manufacturing and quality control, standard deviation is used to monitor the consistency and variation in product measurements or processes. It helps identify deviations from expected values and maintain quality standards.
4. Statistical Analysis: Standard deviation is an important tool in statistical analysis. It's used to describe the distribution of data, compare different datasets, and assess the significance of differences between groups.
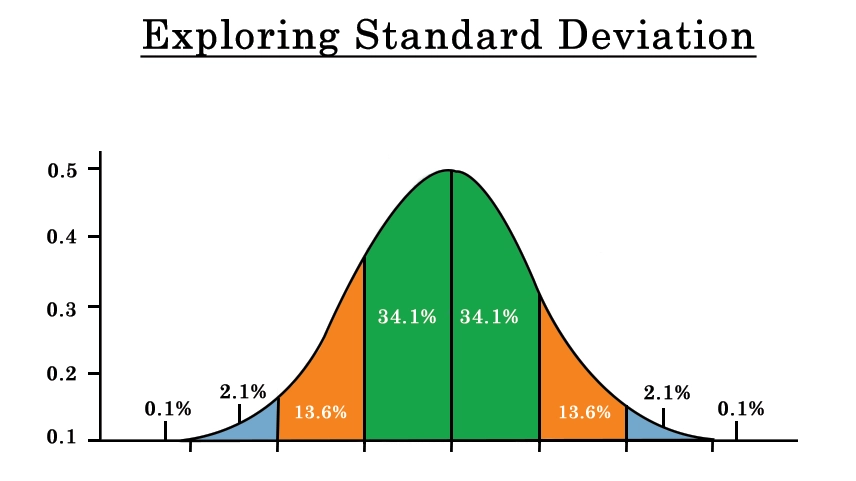
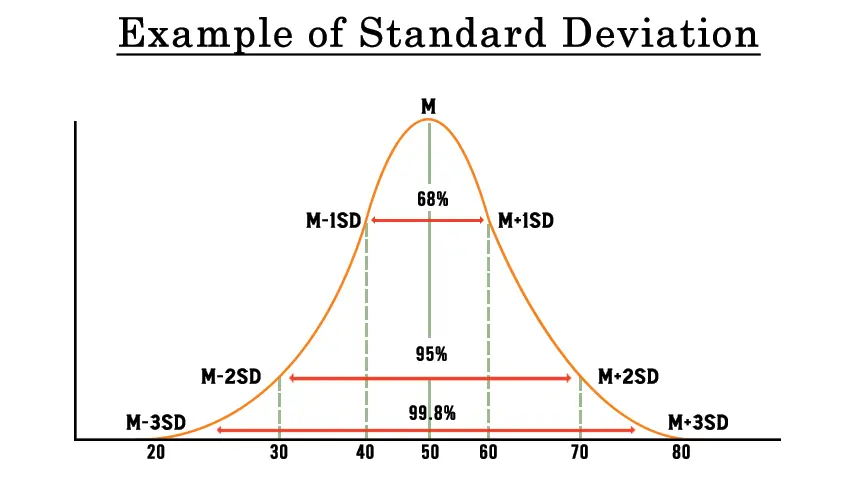
5. Normal Distribution: In statistics, the standard deviation plays a key role in describing the shape of a normal distribution. In a normal distribution, about 68% of the data falls within one standard deviation of the mean, 95% falls within two standard deviations, and 99.7% falls within three standard deviations.
6. Error Bars: In graphs and charts, error bars often represent one or more standard deviations from the mean. They provide a visual representation of the uncertainty or variability in data points.
7. Experimental Results: In scientific research, the standard deviation helps assess the reliability of experimental results. A small standard deviation suggests that measurements are consistent, while a large one might indicate issues with the experiment.
8. Psychology and Education: In psychometrics, the standard deviation is used to assess the spread of scores in psychological and educational tests. It provides insights into the variability of individual performance within a group.
9. Quality of Surveys: When conducting surveys, standard deviation can help assess the consistency or agreement in respondents' answers. It provides a measure of how much responses vary from the mean.
10.Biological and Environmental Studies: Standard deviation is used to quantify variations in biological and environmental measurements. For example, it can be used to measure the variability of temperatures, water quality parameters, and more.
Limitations of Standard Deviation
Standard deviation is a widely used measure of dispersion or variability within a dataset. However, it does have several limitations that you should be aware of:
1. Sensitive to Outliers: Standard deviation is highly influenced by extreme values or outliers in the dataset. Even a single outlier can significantly increase the value of the a good standard deviation, making it less representative of the majority of the data points.
2. Not Robust to Skewed Data: In the presence of skewed distributions, where the data is not symmetrically distributed around the mean, the standard deviation limitations may not accurately reflect the spread of the data. It can be biased towards the tail of the distribution.
3. Does Not Provide Insights into Data Shape: Standard deviation only provides information about the spread of data, but it doesn't offer any insights into the actual shape of the distribution, such as whether it's bell-shaped, uniform, or skewed.
4. Can Be Misleading for Bimodal Distributions: In cases where the data is bimodal (having two distinct modes), the standard deviation might not accurately represent the separation between the modes.
5. Fails to Capture Relative Variation: The standard deviation is an absolute measure of dispersion. It doesn't give you an idea of the relative variation compared to the mean. Coefficient of Variation (CV), which is the ratio of standard deviation to the mean, is often used for this purpose.
6. Assumes Normal Distribution: The standard deviation formula for calculating sample standard deviation assumes that the data follows a normal distribution. In reality, many real-world datasets don't conform to a perfect normal distribution, which can affect the interpretation of the standard deviation.
7. Sample Size Dependency: The standard deviation of a sample tends to be larger than the standard deviation of the entire population. This is important to consider when comparing standard deviations from different sample sizes.
Example of Standard Deviation
standard deviation examples dataset representing the ages of a group of individuals in years: an example of standard deviation
[25, 30, 35, 40, 45]
Step 1: Calculate the Mean (Average)
Mean = (25 + 30 + 35 + 40 + 45) / 5 = 175 / 5 = 35
Step 2: Find out how much each number is different from the average.
Deviations = [25 - 35, 30 - 35, 35 - 35, 40 - 35, 45 - 35] = [-10, -5, 0, 5, 10]
Step 3: Square the Deviations
Squared Deviations = [100, 25, 0, 25, 100]
Step 4: Calculate the Mean of Squared Deviations
Mean of Squared Deviations = (100 + 25 + 0 + 25 + 100) / 5 = 250 / 5 = 50
Step 5: Figure out the average difference between numbers, then find the square root to get the standard deviation.
Standard Deviation = √50 ≈ 7.07
So, the standard deviation of the ages in this dataset is approximately 7.07 years. This value indicates how much the ages deviate, on average, from the mean age of 35. It gives you an idea of the spread or variability of the ages in the dataset. Keep in mind that this is a simplified example, and in real-world scenarios, you would use statistical software to perform these calculations more efficiently.
Conclusion
The standard deviation serves as a fundamental metric for assessing the extent of variability within a dataset. While its widespread use offers valuable insights into data dispersion, its sensitivity to outliers, skewed distributions, and the inability to reveal data shape highlights its limitations. The context of the data and the goals of the analysis should determine whether the standard deviation is the most suitable tool for capturing variability. While recognizing its shortcomings, standard deviation remains a pivotal tool in statistics, particularly when coupled with complementary measures to provide a well-rounded understanding of data characteristics and relationships.
0 comments