Elliott Wave Principle: Unveiling Its Application, Types, Rules, and Key Insights
What is the Elliott wave principle
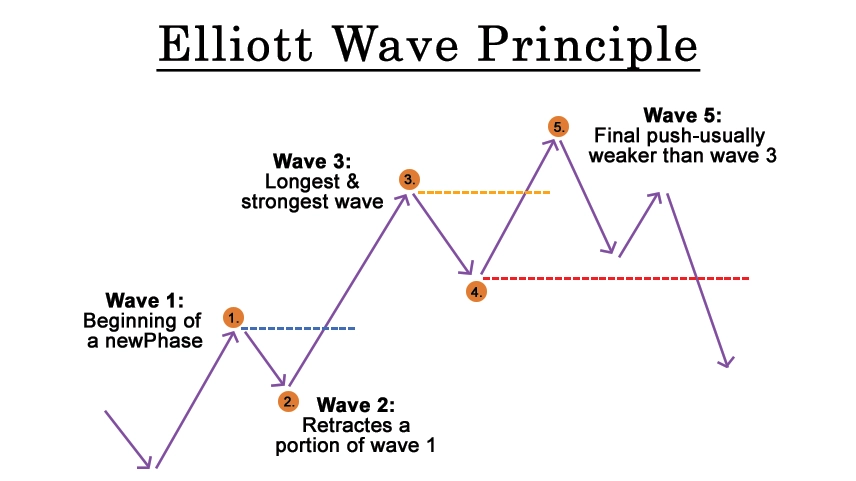
The Elliott Wave Principle is a theory of market analysis developed by Ralph Nelson Elliott. It suggests that financial markets, such as stocks and trading markets, follow predictable patterns influenced by investor psychology and sentiment. This principle proposes that market price movements can be broken down into a sequence of waves, which consist of both upward and downward price movements. Elliott wave theory in share market provides a framework to analyze price patterns based on investor psychology and sentiment. These waves are driven by a combination of psychological factors like fear and greed, as well as external events impacting the market. The central concept of the theory is that market trends follow a distinct pattern of five upward waves along the main direction, followed by three corrective waves against that trend. This pattern is seen as a reflection of market participants' collective behavior. While the Elliott Wave Principle is popular among certain traders and analysts, its effectiveness in consistently predicting market movements remains a subject of debate due to the complexity of market dynamics and the subjective interpretation of patterns.
How to use it
Using the elliott wave theory indicator Principle involves a multi-step process that requires careful analysis and interpretation of price charts. Here's a simplified guide on how to use it:
1. Identify the Main Trend: Begin by identifying the main trend of the market. Determine whether the market is in an uptrend (bull market) or a downtrend (bear market).
2. Count the Waves: Look for the sequence of five waves in the direction of the main trend. These waves are labeled as 1, 2, 3, 4, and 5. These are the impulse waves that represent the upward movement of prices during a bull market or the downward movement during a bear market.
3. Identify Corrective Waves: After the completion of the five-wave impulse pattern, expect a correction. This correction consists of three waves labeled as A, B, and C. Wave A corrects the trend of wave 5, wave B is a corrective wave that partially retraces wave A, and wave C completes the correction.
4. Use Fibonacci Ratios: Within each wave, traders often use Fibonacci ratios to measure the potential price targets and retracement levels. These ratios (such as 0.382, 0.500, 0.618) are derived from the Fibonacci sequence and are believed to be areas where price reversals or extensions might occur.
5. Confirm with Other Indicators: It's crucial to use other technical indicators and tools to validate your Elliott Wave analysis. Common indicators include moving averages, oscillators, and trendlines. This helps to increase the probability of accurate predictions.
6. Practice and Gain Experience: Elliott wave theory accuracy requires practice and experience. Over time, you'll become better at identifying patterns and understanding how market psychology affects price movements.
7. Be Flexible and Adaptable: Markets are dynamic and can be influenced by various factors, including news events, economic data, and geopolitical developments. Therefore, it's important to remain adaptable and adjust your analysis as new information emerges.
8. Manage Risk: Just like with any trading strategy, risk management is crucial. Set stop-loss orders to limit potential losses and ensure that your risk exposure is in line with your trading plan.
Types of Elliott wave principle
The Elliott Wave Principle primarily defines two main types of waves: impulse waves and corrective waves. These waves form the basic building blocks of the theory and are used to analyze and predict market price movements. Here's an overview of these two types:
1. Impulse Waves: Impulse waves are the directional waves that align with the main trend of the market. They are composed of five sub-waves and are labeled as 1, 2, 3, 4, and 5. In an uptrend (bull market), waves 1, 3, and 5 move upward, while in a downtrend (bear market), these waves move downward. Impulse waves represent strong price movement in the direction of the prevailing trend and indicate the market's overall momentum.
2. Corrective Waves: Corrective waves are counter-trend movements that follow the completion of impulse waves. These include three smaller waves identified as A, B, and C. Corrective waves serve to retrace a portion of the price movement generated by the preceding impulse waves. Wave A corrects the price movement of wave 5, wave B is a partial retracement of wave A, and wave C completes the correction by extending in the opposite direction of the prevailing trend.
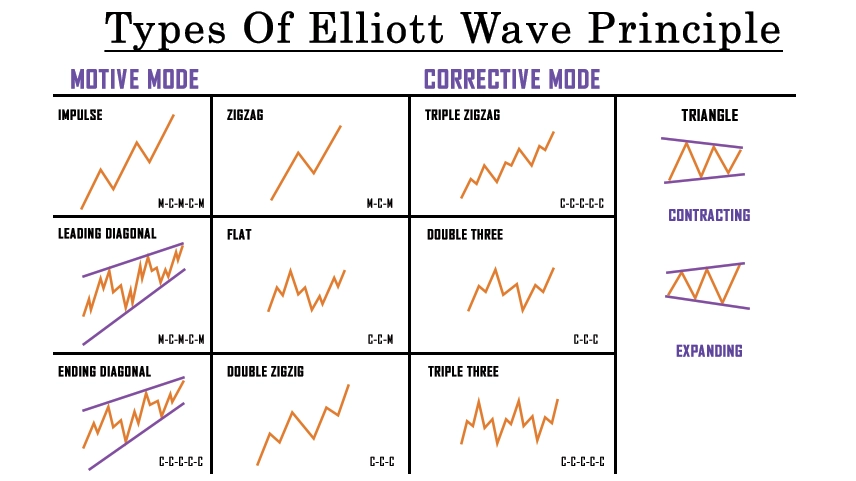
In addition to these main wave types, there are also different patterns and variations that are observed within the Elliott Wave Principal framework. Some of the common patterns include:
• Zigzag: This is a simple corrective pattern composed of three waves (A, B, C) that resemble a "zagged" shape.
• Flat: A flat correction consists of three waves (A, B, C) where wave B is a sideways movement, and wave C moves in the opposite direction of the trend.
• Triangle: Triangles are complex corrective patterns formed by five sub-waves that move within converging trendlines, indicating decreasing volatility.
• Double and Triple Zigzags: These patterns involve a combination of zigzag corrections, indicating more complex corrections in the market.
Rules of Elliott wave principle
The Elliott Wave Principle is governed by a set of rules that help traders identify and interpret wave patterns in financial markets. Here's a concise summary of some key rules:
1. Wave Counts: Impulse waves consist of five sub-waves (1, 2, 3, 4, 5), and corrective waves consist of three sub-waves (A, B, C).
2. Wave Progression: Wave 2 never retraces more than 100% of Wave 1, and Wave 4 never enters the price territory of Wave 1.
3. Wave Lengths: Wave 3 is usually the longest and never the shortest among waves 1, 3, and 5. Wave 2 is often shorter in length than waves 1 and 3.
4. Alternation Principle: If wave 2 is a simple correction, wave 4 tends to be a more complex correction (and vice versa).
5. Wave Relationships: Waves 2 and 4 often exhibit a Fibonacci retracement relationship in relation to each other.
6. Channeling: Impulse waves usually move within a channel, and corrective waves might move in a broader channel or triangle pattern.
7. Wave Extension: Wave 3 is often an extended wave, meaning it's longer than waves 1 and 5.
Conclusion
Elliott Wave Principle is a market analysis theory developed by Ralph Nelson Elliott that suggests financial markets move in repetitive patterns driven by investor psychology and sentiment. This principal divide market price movements into impulse waves, which follow the main trend, and corrective waves, which counter the trend. While its application can be subjective and complex, the theory provides traders and analysts with a framework to understand market behavior and potentially predict future price movements.
Successful utilization of the Elliott Wave Principle involves recognizing and interpreting wave patterns, employing supporting technical indicators for validation, and practicing risk management. Although it lacks specific mathematical formulas, its value lies in its ability to offer insights into market psychology and sentiment, empowering traders to make informed decisions. However, it's important to remember that the Elliott Wave Principle a key to market behavior is not foolproof and requires continuous learning, experience, and adaptability to effectively navigate the dynamic landscape of financial markets.
0 comments